Fixed Percent Stop Loss & Take Profit % - For Study Scripts===========
Fixed Percent Stop Loss & Take Profit % - { FOR STUDY SCRIPTS! }
===========
A neat example of how to set up Fixed Stops and Take Profit as a percent of the entry price - This is for setting Alerts within your own Study Script for when either your SL or TP get hit.
Yup, that's about it!
You can ignore the actual entry/exit orders - they're based on a simple MA cross and are therefore NOT relevant, NOT profitable and NOT recommended!
You should be using this code as a way of adding Stops and Takes to your own scripts - hope it helps!
Set your "Open Long/Short" Alerts to be triggered "Once per Bar Close" - Set your "SL/TP" Alerts to trigger "Once per Bar".
--
We wrote this with a bit of a rush on! ~ If you spot any mistakes/bugs just let us know and we'll get round to them asap!
-----------
Good Luck and Happy Trading!
在脚本中搜索"take profit"

Take Profit XTake Profit X
Take Profit X solves the #1 problem in trading: knowing when to exit. Instead of guessing or using single indicators, it aggregates 8 technical signals to identify high-probability exit points through multi-confirmation consensus. This eliminates premature exits and emotional decision-making.
The indicator counts confirmations from your chosen technical tools:
Green dot = Multiple signals say "take profit on longs/exit shorts"
Red dot = Multiple signals say "take profit on shorts/exit longs"
Signals appear when you reach the minimum confirmations threshold you set.
Possible Settings:
Conservative (Swing Trading)
pine
Minimum Confirmations: 4
Use: RSI, MACD, CCI, Supertrend, Price Action
Disable: Stochastic, Bollinger Bands, EMA Cross
Look Back Bars: 10
Aggressive (Day Trading)
pine
Minimum Confirmations: 2
Use: All indicators ON
Look Back Bars: 3-5
RSI OB/OS: 75/25
Balanced (Most Markets)
pine
Minimum Confirmations: 3
Use: RSI, MACD, CCI, Supertrend
Price Action: ON
Look Back Bars: 5-7


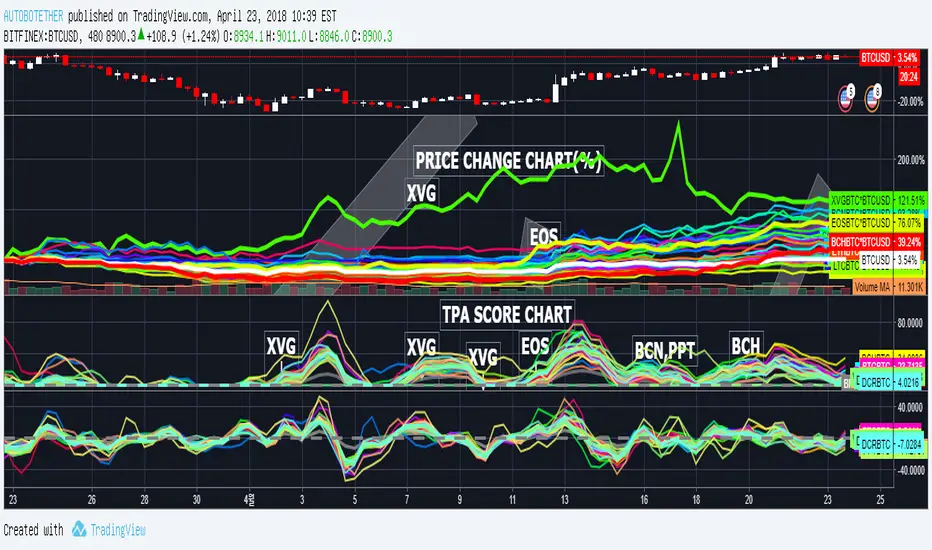
TAKE PROFIT AGAIN SCORE(TPA)_MARKETCAP verTAKE PROFIT AGAIN SCORE(TPA)_MARKETCAP
또땃 스코어 상위시총 ver
------------------------------------------------------------------------------
This indicator is designed to find coins that are strong in market conditions.
It is recommended that users have an understanding of basic charts.
Careful investment is needed after the trend of the score itself has been on the downward trend.
Coins usually give the strongest return that run at the top of the score.
The realization of the profit on the chart must be done by the person himself.
When purchasing coins at the top of the score chart, we recommend the number of sheets at the adjustment point on the chart.
Because this index is a trend score, you may not be able to catch the start wave. To do this, use a starting wave catcher.
The coins listed in this index are coins of the highest rank in order of Market Cap and will be updated at regular intervals.
At last year's rise of coin, it is based on catching light coin, Qtum, ripple, Ada , Stella, Tron rise.
Indicator vouchers will only be available to a small number of paid subscribers.
Thank you.
---------------------------------------------------------------------------------------------
이 지표는 시장 상황에서 강세를 띠는 코인을 찾아내기 위해 만들어 졌습니다.
기본적인 차트에 대한 이해가 있는 사용자가 사용하길 권합니다.
스코어자체의 추세가 하향을 한 이후는 신중한 투자가 필요합니다.
통상 가장 강한 수익을 주는 코인이 스코어 최상단을 달립니다.
차트상의 수익실현은 본인이 직접 수행해야 합니다.
통상 스타팅 파동을 잡아내는 스타팅 파동 캐쳐와 함께 사용합니다.
스코어차트상 최상단의 코인을 매수 할 시 차트상 조정지점에서 매수를 권합니다.
본 지표는 트렌드 점수 이기 때문에 시작 파동을 잡아내지 못할 수 있습니다.
이를 위해선 스타팅웨이브 캐쳐를 함께 사용합니다.
본 지표에 나와있는 코인들은 마켓 캡으로 상위등급의 코인들이며 일정 간격으로 업데이트 될 것입니다.
작년 코인상승장에서, 라이트코인,Qtum,리플,에이다,스텔라,트론 상승을 잡아낸 기반지표 입니다.
지표 이용권은 소수의 유료 구독 사용자들에게만 공개될 예정입니다.
감사합니다.
추가적으로 시장 싸이클 상에서 바닥 이후 가장 효과를 발휘하는 지표입니다.
마켓캡 상위 코인들에 대한 지표적용을 함으로 단발펌핑물림이나, 안정성을 떠난 매매에서 당신을 보호할 수 있습니다.
Take Profit CalculatorRelease Notes: Take Profit Calculator v1.0
Introduction
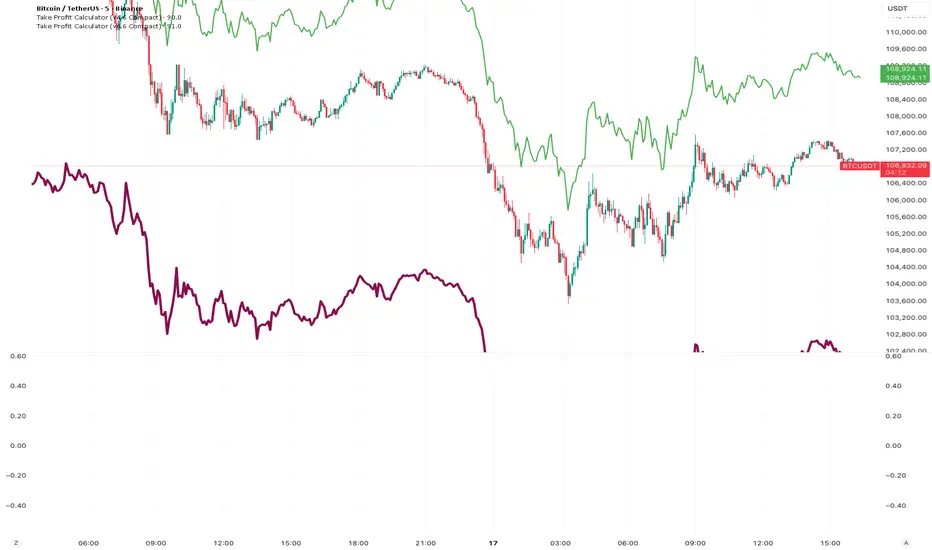
Introducing the Real-Time Take Profit Calculator, a dynamic tool for TradingView designed to instantly calculate and display your target exit price. This indicator eliminates the need for manual calculations, allowing scalpers and day traders to see their profit targets directly on the chart as the market moves.
Key Features
Dynamic Target Calculation: The take-profit line is not static. It recalculates on every tick, moving with the current price to show you the exact target based on a real-time entry point.
Full Trade Customization:
Margin: Set the amount of capital (in USDT) you are allocating to the trade.
Leverage: Input your desired leverage to accurately calculate the total position size.
Desired Profit: Specify your target profit in USDT, and the indicator will calculate the corresponding price level.
Long & Short Support: Easily switch between "Long" and "Short" trade directions. The indicator will adjust the calculation and the visual style accordingly.
Customizable Display:
Change the color and width of the take-profit line for both long and short scenarios.
Toggle a price label on or off for a cleaner chart view.
How to Use
Add to Chart: Apply the "Take Profit Calculator" indicator to your chart.
Open Settings: Double-click the indicator name or the line itself to open the settings panel.
Enter Your Parameters: Under "Trade Parameters," fill in your Margin, Leverage, and Desired Profit.
Select Direction: Choose either "Long" or "Short" from the Trade Direction dropdown.
Analyze: The horizontal line on your chart now represents the exact price you need to reach
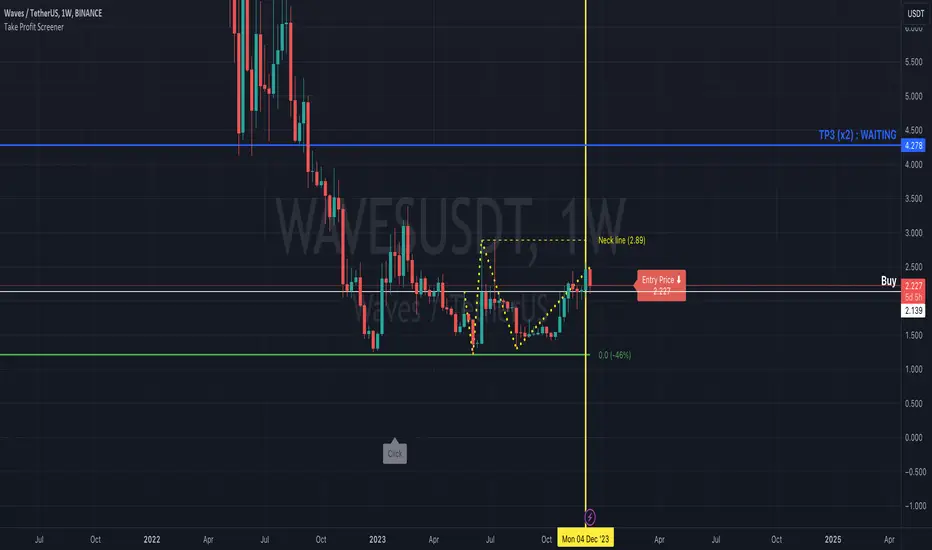
Take Profit ScreenerI'm going to introduce you to the Take Profit Screener tool.
It allows you to manually scan your watchlist to determine at a glance the assets that have the best profitability potential.
It is a 2 in 1 tool that allows you to :
identify where your Take Profit ratios are located whether you are in SHAD or Cycle Strategy
identify the potential reward percentages when approaching the key Fibonacci levels
Before you start using it, you need to:
sort your watchlist according to the price (Last) in order to have price ranges more or less close to each other when jumping from a symbol to another
disable the Auto Scale and Magnet feature
select your first symbol
display the tool (the indicator more exactly)
The settings dialog box is organised in 3 sections:
Strategy : By setting this section, you will answer the question " Where do my Take Profit ratios stand in relation to my entry price, and according to Risk Management Strategy adopted (SHAD or Cycle)? "
Fibonacci : By setting this section, you will answer the question " What percentage gain can I expect as I approach one of the key Fibonacci levels? "
Layout : This is the settings for the look and feel
Strategy Section
Active : This part of the indicator won't display on your chart if unchecked
Type : Choose between SHAD or Cycle Strategy. When choosing SHAD, you can select 2, 4, 8 or 16 SHAD Levels. When choosing Cycle, you can enter whatever ratio value you wish in the Strategy Ratio (Cycle only) input.
SHAD xNN : When choosing SHAD Strategy, you should select at least one level and more if need be.
Strategy Ratio (Cycle only) : When choosing Strategy Type Cycle, you can enter whatever ratio value you wish there.
Freeze Entry Price & Value : Leave it unchecked whenever the current price of the asset is located within your desired area (i.e. Reload Zone) while attempting to estimate its potential reward. Conversely, keep it checked whenever the current price of the asset is outside your desired area, but you need to anticipate the potential reward of this asset if its price reaches a certain level, your Entry price. Enter this price there and check the box.
Show price : If checked, both Take Profit ratio and Price are displayed. If unchecked, then price is hidden.
Extend Line : If checked, then lines showing Take Profit levels extend to the left.
Label Offset : If checked, then the label that displays Take Profit ratio and price shift to the right by a value that ranges from 0 to 100 candles.
Label Style : You can choose between Right or Top. This will determine the orientation of the label.
Fibonacci Section
Active : This part of the indicator won't display on your chart if unchecked
Type : Choose between SHAD or Cycle Strategy. When choosing SHAD, you can select 2, 4, 8 or 16 SHAD Levels. When choosing Cycle, you can enter whatever ratio value you wish in the Strategy Ratio (Cycle only) input.
SHAD xNN : When choosing SHAD Strategy, you should select at least one level and more if need be.
Strategy Ratio (Cycle only) : When choosing Strategy Type Cycle, you can enter whatever ratio value you wish there.
Freeze Entry Price : Leave it unchecked whenever the current price of the asset is located within your desired area (i.e. Reload Zone) while attempting to estimate its potential reward. Conversely, keep it checked whenever the current price of the asset is outside your desired area, but you need to anticipate the potential reward of this asset if its price reaches a certain level, your Entry price. Enter this price there and check the box.
Color : You can define the color of Fibonacci line levels
Take Profit ModelThis Indicator allows you to define 9 Taking Profit levels between your floor price and a target price you define for 10 selectable Assets and tweak the levels to your preference. It does not do any fancy dynamic calculations, it just draws lines on the chart where you want them so that you have an easy reference for when to take profit (or not).
Example:
So, if your floor price for an asset is e.g. $10 and your target price is $110 (its up to you to define, who knows right, I do not have a crystal ball), You have a range of $100 where you can set your levels as follows
The first level is the Floor price you entered = $10
Formula: Level x (Target - Floor) + Floor = Take Profit level
Levels
0.1 x (110 - 10) + 10 = $20
0.2 x (110 - 10) + 10 = $30
0.3 x (110 - 10) + 10 = $40
0.4 x (110 - 10) + 10 = $50
0.5 x (110 - 10) + 10 = $60
0.6 x (110 - 10) + 10 = $70
0.7 x (110 - 10) + 10 = $80
0.8 x (110 - 10) + 10 = $90
0.9 x (110 - 10) + 10 = $100
And finally the last level is drawn for the target price
Target Price = $110
To change the settings, go to the cog icon of the Indicator, select the assets (Tickers) you have and next enter a value between 0 and 1 (as shown above) for each level, and if you want a different color. Instead of using 0.1-0.9 you e.g. can also use Fibonacci numbers like 0.235, 0.382, 0.618, 0.786 and disable (using the check mark) the rest of the levels. Experiment with this as you see fit.
Make sure that the chart you are looking at in TradingView is the same as you select in the indicator configuration e.g. COINBASE:BTCUSD should be selected as the chart as well as the Ticker in the configuration.
The Start date of the script is configurable (one date across all assets and levels)
The colors of the Levels is configurable (I am colorblind so go wild)
The standard values in the script are just examples, you need to determine the values that apply in your case and do your own research.
Your feedback is most welcome

Take profit and Stop Loss ATR HL [Tcs] | ALGOThis indicator helps traders set stop loss and take profit levels based on either ATR or High-Low range.
The indicator calculates stop loss and take profit levels for both long and short positions, based on the user's input of ATR length, ATR smoothing method, and multiplier levels for each level. It’s possible to set 3 levels of take profit, for both long and short trades.
The indicator also includes the option to show or hide levels, bands, and labels for the calculated stop loss and take profit levels.
Additionally, the indicator has a function to calculate the user's risk based on their account balance, risk percentage, and broker fees.
Overall, this indicator can be helpful for traders who use stop loss and take profit levels in their trading strategies and want a visual representation of those levels on their charts.
Please note that this indicator is for educational purposes only and should not be used for trading without further testing and analysis.

Take ProfitThis simple indicator shows gains/ losses and profit taking opportunities for a strategy that consists of regularly investing a static sum to an asset (ex: adding $25 to BTC every week).
White = Investment (new money)
Green = Take-profit
Purple = Total Gains / Losses on + investment
Blue = Total Gains / Losses on + investment - take-profit
Red = Total Gains / Losses on - investment
Orange = Total Gains / Losses on - investment - take-profit
RedBG = Orange < 0
GreyBG = Weekend
Settings:
- Amount to invest each week
- Day of the week to invest (1 = Sunday, time is defaulted to 12:01 AM of that day)
- Amount at which to take profit
- Start time (This is calculated in weeks since UNIX Epoch; increasing the number by 1 means moving the start time forward 1 week)
Enjoy!

TAKE PROFIT AGAIN SCORE[CATCHER](TPA)_MARKETCAP또땃 스코어 보조용 스타팅 파동 감지지표 시가총액 ver
TAKE PROFIT AGAIN SCORE (TPA)_MARKETCAP
------------------------------------------------------------------------------
This indicator was created to complement "Take Profit Again Trend Score (Crpto Catcher) _Marketcap".
Take Profit Again Trend Score(Crpto Catcher)_Marketcap
It is aimed to start or stop the decline in value and detect the beginning of the wave.
The coin that goes up the river of score wave is likely to give a good performance.
The TPA Trend Score indicator is a good indicator of the adequacy of a sell-off.
If the starting score is negative even though the TPA score is the highest, you have to set and hold a loss cut on the chart or chart.
---------------------------------------------------------------------------------------------
이 지표는 "Take Profit Again Trend Score(Crpto Catcher)_marketcap"를 보완하기 위해 만들어졌습니다.
시작하거나 대세가치하락에서 견뎌내고 파동시작을 감지하는 목적입니다.
점수 파동의 강물을 거슬러 올라가는 코인이 좋은 성과를 줄 확률이 높습니다.
TPA Trend Score 지표와 함께 매수매도의 적절성을 판단하기에 좋습니다.
TPA스코어가 가장 높더라도 Starting 스코어가 음수로 가게 된다면 매도 내지는 차트상 로스컷을 정하고 홀딩해야합니다.

Take Profit Again Score (Starting Wave Catcher)_BinanceTPA (Starting Wave Catcher)_BINANCE ver
또땃 스코어 보조용 스타팅 파동 감지지표 바이낸스 ver
------------------------------------------------------------------------------
This indicator was created to complement "Take Profit Again Trend Score (Crpto Catcher) _Binance".
It is aimed to start or stop the decline in value and detect the beginning of the wave.
The coin that goes up the river of score wave is likely to give a good performance.
The TPA Trend Score indicator is a good indicator of the adequacy of a sell-off.
If the starting score is negative even though the TPA score is the highest, you have to set and hold a loss cut on the chart or chart.
---------------------------------------------------------------------------------------------
이 지표는 "Take Profit Again Trend Score(Crpto Catcher)_Binance"를 보완하기 위해 만들어졌습니다.
시작하거나 대세가치하락에서 견뎌내고 파동시작을 감지하는 목적입니다.
점수 파동의 강물을 거슬러 올라가는 코인이 좋은 성과를 줄 확률이 높습니다.
TPA Trend Score 지표와 함께 매수매도의 적절성을 판단하기에 좋습니다.
TPA스코어가 가장 높더라도 Starting 스코어가 음수로 가게 된다면 매도 내지는 차트상 로스컷을 정하고 홀딩해야합니다.

[MS-Take Profit & Trailing Stop] betaTake Profit & Trailing Stop trigger - this is beta quality script for internal testing only

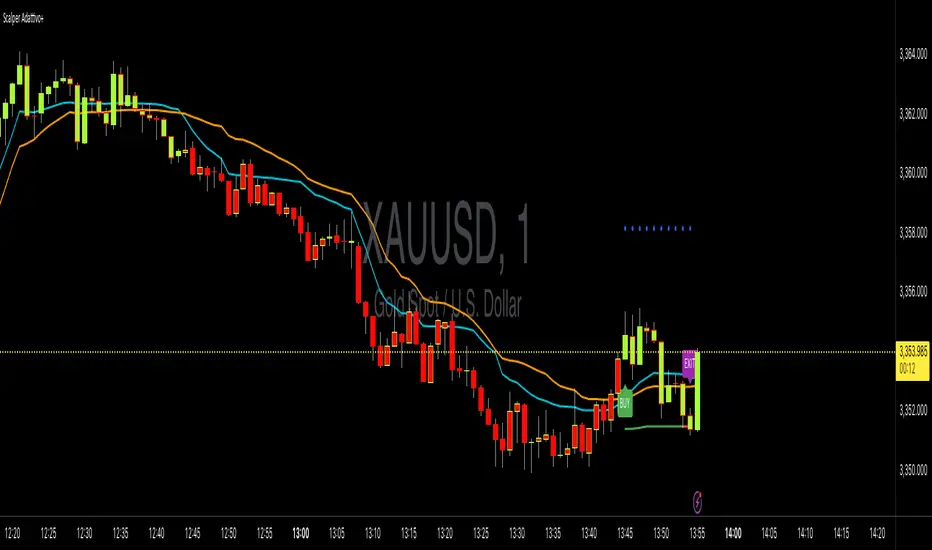
Adaptive Scalping with Take ProfitThis is a comprehensive and adaptive trading system designed specifically for scalping XAUUSD (Gold) on a 3-minute timeframe. Its main feature is that it "adapts" to current market conditions rather than using fixed parameters. It provides clear BUY, SELL, and EXIT signals directly on the chart.
Key Components
1. Adaptive Entry Signal (KAMA)
Instead of using standard moving averages (like EMA or SMA), the entry logic is based on Kaufman's Adaptive Moving Average (KAMA).
How it's adaptive: KAMA automatically adjusts its speed based on market noise. It moves slowly when the market is choppy and sideways, filtering out many false signals. It speeds up when a clear trend emerges, allowing you to enter a move early.
A BUY signal is generated when the faster KAMA crosses above the slower KAMA. A SELL signal is generated on a cross-under.
2. Volatility Filter
The system includes an optional filter that uses the Average True Range (ATR) to measure market volatility.
A trade signal will only appear if the market is volatile enough for scalping. This prevents you from entering trades when the market is flat and there's little opportunity for profit.
3. Dual Exit Strategy (Adaptive)
This is the most advanced part of the system. It gives you two ways to exit a trade to maximize and protect profits:
Dynamic Take Profit: When a trade starts, a profit target (the blue circles) is immediately plotted on the chart. This target is calculated using the ATR, so on a volatile day, the target will be further away. If the price hits this level, it's a signal to take your profits.
ATR Trailing Stop: This is your safety net. It's a stop loss that automatically "trails" behind the price as it moves in your favor (the green/red line). If the market suddenly reverses, the trade is closed when the price hits this trailing stop, locking in any accumulated profit.
An EXIT label appears on the chart as soon as one of these two conditions is met.
4. On-Chart Visuals
BUY/SELL/EXIT Labels: Clear, unmissable labels appear to show you exactly when to enter and exit.
Bar Coloring: The chart candles are colored green when the trend is bullish (fast KAMA > slow KAMA) and red when the trend is bearish, giving you an instant visual confirmation of the market sentiment.
ATR Stop-Loss with Fibonacci Take-Profit [jpkxyz]ATR Stop-Loss with Fibonacci Take-Profit Indicator
This comprehensive indicator combines Average True Range (ATR) volatility analysis with Fibonacci extensions to create dynamic stop-loss and take-profit levels. It's designed to help traders set precise risk management levels and profit targets based on market volatility and mathematical ratios.
Two Operating Modes
Default Mode (Rolling Levels)
In default mode, the indicator continuously plots evolving stop-loss and take-profit levels based on real-time price action. These levels update dynamically as new bars form, creating rolling horizontal lines across the chart. I use this mode primarily to plot the rolling ATR-Level which I use to trail my Stop-Loss into profit.
Characteristics:
Levels recalculate with each new bar
All selected Fibonacci levels display simultaneously
Uses plot() functions with trackprice=true for price tracking
Custom Anchor Mode (Fixed Levels)
This is the primary mode for precision trading. You select a specific timestamp (typically your entry bar), and the indicator locks all calculations to that exact moment, creating fixed horizontal lines that represent your actual trade levels.
Characteristics:
Entry line (blue) marks your anchor point
Stop-loss calculated using ATR from the anchor bar
Fibonacci levels projected from entry-to-stop distance
Lines terminate when price breaks through them
Includes comprehensive alert system
Core Calculation Logic
ATR Stop-Loss Calculation:
Stop Loss = Entry Price ± (ATR × Multiplier)
Long positions: SL = Entry - (ATR × Multiplier)
Short positions: SL = Entry + (ATR × Multiplier)
ATR uses your chosen smoothing method (RMA, SMA, EMA, or WMA)
Default multiplier is 1.5, adjustable to your risk tolerance
Fibonacci Take-Profit Projection:
The distance from entry to stop-loss becomes the base unit (1.0) for Fibonacci extensions:
TP Level = Entry + (Entry-to-SL Distance × Fibonacci Ratio)
Available Fibonacci Levels:
Conservative: 0.618, 1.0, 1.618
Extended: 2.618, 3.618, 4.618
Complete range: 0.0 to 4.764 (23 levels total)
Multi-Timeframe Functionality
One of the indicator's most powerful features is timeframe flexibility. You can analyze on one timeframe while using stop-loss and take-profit calculations from another.
Best Practices:
Identify your entry point on execution timeframe
Enable "Custom Anchor" mode
Set anchor timestamp to your entry bar
Select appropriate analysis timeframe
Choose relevant Fibonacci levels
Enable alerts for automated notifications
Example Scenario:
Analyse trend on 4-hour chart
Execute entry on 5-minute chart for precision
Set custom anchor to your 5-minute entry bar
Configure timeframe setting to "4h" for swing-level targets
Select appropriate Fibonacci Extension levels
Result: Precise entry with larger timeframe risk management
Visual Intelligence System
Line Behaviour in Custom Anchor Mode:
Active levels: Lines extend to the right edge
Hit levels: Lines terminate at the breaking bar
Entry line: Always visible in blue
Stop-loss: Red line, terminates when hit
Take-profits: Green lines (1.618 level in gold for emphasis)
Customisation Options:
Line width (1-4 pixels)
Show/hide individual Fibonacci levels
ATR length and smoothing method
ATR multiplier for stop-loss distance

kaptanFantastik[Take Profit and Stop Loss Finder]Hello all,
It's ATR based active take profit & stop loss finder.
You can set multipliers for taking profit and stop losing and you can change the price source for the calculation. Also, you can change the ATR level.
Defaults are my best settings. 2.2x for taking profit and 1.5x for stop losing. Open price is the source. Also, I think 5 ATR is the best for day and swing trade.
Levels are determined according to the open prices (This is because we can enter the position after our other indicators give the signal following the close price. Yet, you can change it). Since it's active and based on my calculation with ATR values, percentages for the taking profits and stop losing may change. Because of this, you need to note the take profit and stop lose prices after your entry price level is determined by the other indicators for the best success rates.
It can be used in any time frame with the other indicators to determine the best entry points. For example, 3 EMA levels with 5,8 and 13 is good option for the entry. You can enter the position when 5 crosses up 8 and both are above the 13. You can also use custom more advanced buy/sell indicators with this one for entry points.
It can be used with any asset from cryptocurrency to the stocks, from forex to gold etc.
Hint: You can set your levels lower than the take profit prices to maximize the success rate.
Note: Market should be open for the positions.
Example trade on the 5-minute timeline.
The below chart has both my custom indicator and the 3 EMAs mentioned above.
Trade 1: Entry price: 19191, Take Profit: 19276. Profit 0.44%
Trade 2: Entry price: 19189, Take Profit: 193009. Profit 0.625%
Türkçe bilen kullanıcılar için açıklama
Herkese merhabalar,
ATR tabanlı aktif kar al ve zararı durdur bulucu.
Kar almak ve zararı kesmek için çarpanlar belirleyebilir ve hesaplama için fiyat kaynağı değiştirebilirsiniz. Ayrıca, ATR seviyesini de değiştirebilirsiniz.
Varsayılanlar benim en iyi ayarlarım. Kar almak için 2,2 kat ve zararı durdurmak için 1,5 kat. Açılış, fiyat kaynağıdır. Ayrıca, 5 ATR'nin günlük ve kısa vade (swing trade) için en iyisi olduğunu düşünüyorum.
Seviyeler açılış fiyatına göre belirlenir (Çünkü diğer göstergelerimiz kapanış fiyatının ardından sinyal verdikten sonra pozisyona girebiliyoruz. Yine de bunu değiştirebilirsiniz). Aktif olduğu için ve ATR değerleri ile yaptığım hesaplamaya göre kar alma ve zarar kes yüzdeleri değişebilir. Bu nedenle, en iyi başarı oranları için; giriş fiyat seviyeniz diğer göstergeler tarafından belirlendikten sonra kar al ve zararı durdur fiyatlarını not etmeniz gerekir.
En iyi giriş noktalarını belirlemek için diğer göstergelerle herhangi bir zaman diliminde kullanılabilir. Örneğin, 5,8 ve 13 ile 3 EMA seviyesi giriş için iyi bir seçenektir. 5, 8'i geçtiğinde ve her ikisi de 13'ün üzerinde olduğunda pozisyona girebilirsiniz. Giriş noktaları için bununla birlikte daha gelişmiş özel al/sat göstergelerini de kullanabilirsiniz.
Kripto paradan hisse senetlerine, forexten altına vb. her türlü varlıkla kullanılabilir.
İpucu: Başarı oranını en üst düzeye çıkarmak için seviyelerinizi kar alma fiyatlarından daha düşük ayarlayabilirsiniz.
Not: Pozisyonlar için piyasa açık olmalıdır.
5 dakikalık zaman çizilgesinde örnek işlem.
Yukarıdaki örnek grafikte hem özel indikatörüm hem de yukrıda belirtilen 3 EMA var.
İşlem 1: Giriş fiyatı: 19191, Kazanç Al: 19276. Kar %0.44
İşlem 2: Giriş fiyatı: 19189, Kazanç Al: 193009. Kar %0.625

OH2B Take Profit IndicatorOH2B Trading Indicator
The Take-Profit Indicator gives you exit points for taking profits based on the Average Directional Index and Relative Strength Index.
It also gives you possible swing-high and swing-low in a trend .
The OH2B Trading Indicator is an indicator that gives you entry points for BUY and SELL based on Trend Channel and Ema-Crossover.
Both indicators work better in tandem with the best result.
Trading with Both Indicators
Orange Zone : Wait for the next signal from OH2B Trading Indicator.
The OH2B Trading Indicator gives you entry points for BUY or SELL .
When the ema1 crosses above ema2, the trend channel will be painted GREEN in color, and a BUY signal will appear. = BUY
When the ema1 crosses below ema2, the trend channel will be painted RED in color, and a SELL signal will appear. = SELL
When a BUY or SELL signal appears on the chart, don't rush into any trade.
Please allow a few hours for confirmation of signals .
To take profit, please follow the Take-Profit Indicator at the bottom.
RED dots are the Take-Profit targets for the BUY (long) signal
GREEN dots are the Take-Profit targets for the SELL (short) signal
*After taking profit, please set a Stoploss to at least break-even level to protect your profits.
When the price enters the Orange Zone again, you may close your trade and wait for the next signal.
If you like to keep your positions at Orange Zone, please remember to set a stop-loss alert when an opposite signal pops up on the chart.
Often the price goes to the Trendline after the signal, so keep some funds to increase the position or even open all position near the Trendline , or use it for re-enter with SL after you closed position on TPs.

Parabolic Scalp Take Profit[ChartPrime]Indicators can be a great way to signal when the optimal time is for taking profits. However, many indicators are lagging in nature and will get market participants out of their trades at less than optimal price points. This take profit indicator uses the concept of slope and exponential gain to calculate when the optimal time is to take profits on your trades, thus making this a leading indicator.
Usage:
In essence the indicator will draw a parabolic line that starts from the market participants entry point and exponentially grows the slope of the line eventually intersecting with the price action. When price intersects with the parabolic line a take profit signal will appear in the form of an x. We have found that this take profit indicator is especially useful for scalp trades on lower timeframes.
How To Use:
Add the indicator to the chart. Click on the candle which the trade is on. Click on either the price which the trade will be at, or at the bottom of the candle in a long, or the top of a candle in a short. Select long or short. Open the settings of the indicator and adjust the aggressiveness to the desired value.
Settings:
- Start Time -- This is the bar in which your entry will be at, or occured at and the script will ask you to click on the bar with your mouse upon first adding the script.
- Start Price -- This is the price in which the entry will be at, or was at and the script will ask you to click on the price with your mouse upon first adding the script.
- Long/Short -- This is a setting which lets the script know if it is a long or a short trade, and the script will ask you to confirm this upon first adding it to the chart.
- Aggressiveness -- This directly affects how aggressive the exponential curve is. A value of 101 is the lowest possible setting, indicating a very non-aggressive exponential buildup. A value of 200 is the highest and most aggressive setting, indicating a doubling effect per bar on the slope.

[Shitcoin Paradise]Take Profit + Stop LossThe Take profit + Stop loss indicator is built around The Matrix strategy , it is not suitable for anything else!
*Use it only on 4h charts*
How to use it:
- when a setup from The Matrix is ready, set the date and hour when that setup happened
- set the entry price
- set the targets (you can use the default ones)
- for conservative trading, check the "Use only one TP?" box
- set alert messages for every event
When the price reached the first TP, the stop loss will automatically be moved at entry price, yellow line (entry price) become red(stop loss).
The indicator can be set to have 3 take profits (it takes longer to finish a trade, the reward is greater, but also the risk is bigger), or the conservative way, with only one take profit.
The Take profit + Stop loss indicator uses 3 different stop losses in cascade, multiple algorithms and MTF to calculate them and calculate the starting point, from where the targets are calculated.
Scenario 1:
The price have a setup for continuing the trade, the price touches 1st TP, SL is moved to the entry price, the price reaches all targets => the trade is closed.
Scenario 2:
The price have a setup for continuing the trade, the price touches 1st TP, SL is moved to the entry price, the price fail to touch the other TPs and SL is triggered.
Scenario 3:
The price does not have a setup for continuing the trade, the SL is triggered.
Scenario 4 (conservative trading):
The price have a setup for continuing the trade, the price touches 1st TP => the trade is closed.
For invites, more details and questions, you can send us a private message.
Enjoy!
Shitcoin Paradise

ComboTrade V.2.1 (BuySell Signals,Take profit,4MA,Fibo,Ichi+QL)A WORD WITH ESTEEMED TRADERS:
The type of indicator that a trader uses to create a strategy depends on the type of strategy he intends to employ; this is related to the trading style and the trader's loss tolerance.
A trader looking for a long-term trade with high profits may adopt a follow-up strategy, and on the other hand, a trader who decides to make short-term trades with frequent but low profits may be eager to use a strategy based on price fluctuations. Different types of indicators can be used to confirm the results.
Indicators alone should not be used as a tool to make trading decisions. Instead, every trader should use indicators to receive trading signals and formulate trading strategies and determine his or her exact method.
Brief and essential description:
With the above description, traders are advised to use the ComboTrade indicator as a trading assistant. Using the tools embedded in this trading assistant makes it easy for traders and depending on the trading strategy, you can get the best result for positioning.
Note 1: The trading time frame for ComboTrade with over one hour (1H) will achieve best result. Checking out the lower time frame to buy or sell as a confirmation is recommended.
Note 2: At Trading View home screen choose “ Candles or ...” as “Bar’s Style”.
Once you added ComboTrade into to your chart, go to the setting gear of the ComboTrade indicator, which includes two sections: “Input” and “Style”.
The “Input” section is for the input values of the indicators and the “Style” section is for activating and deactivating the tools.
Activate Moving Average 7, 21, 50 and 200 with close (Default)
Activate Combo Cloud by tick the “Show ichimoku” if you use it (Default)
By activating ichimoku, three components will be added to the Como Cloud with below details:
1- The “Quality Line” shows the quality line (26 Kijun-sen future candlesticks) which helps the trader to understand the direction of the trend and will help the trader to make a decision.
2. The “Period Line” shows the 103-day period and can act as a support and resistance tool. In addition, this number can be changed.
3- The intersection of various Como cloud lines has also been installed.
The TP (Take Profit) signal indicates a similar buy or sell area using the RSI and Stochastic oscillators, and be sure to pay special attention to it. Be sure to tick the related box (TP) at “Style” section.
The “Trailing Stop” at “Style” section acts as a support and resistance line. It acts as a support when the price candle is placed above the Trailing Stop line and as a resistance if the price candle is placed below the Trailing Stop line.
At “Bot Key Value” in “Input” section, the number is adjustable from 0.25 to any number. According to the trader's strategy, the number of input and output signals in this section can be adjusted. The best number for BTC is 0.78 and for Altcoins is 0.78 to 1.
At “Bot ATR Period” in “Input” section, the best default number is 8. The best values for Altcoins is 8 to 10, which has a significant effect on the regulation of signaling and support and authority lines.
The “Bot Buy” and “Bot Sell” at “Style” section are the main and most important parts of the indicator that you must tick in order to active them both.
“Plot Background” can activate the Como Cloud and set it to green (ascending) and red (descending).
The “Labels” and “Lines” are related to the important Fibonacci tool, which by displaying the lines of the Fibonacci lines and by activating the label, the numbers related to the price and the Fibonacci numbers are displayed. It helps traders to extract data from the last few days.
DISCLAIMER:
ALL DECISIONS AND RISK MANAGEMENT, ETC. ARE THE FULL RESPONSIBILITY OF THE TRADER AND THE AUTHOR IS NOT RESPONSIBLE FOR THE POSITIONS AND THE RESULTS OF THE TRADES (POSSIBLE LOSSES) IN ANY WAYS. DO YOUR OWN RESEARCH (DYOR) BEFORE ENTERING/ EXISTING IN TO/ FROM ANY POSITIONS.
Please like and use your comments after using the indicator.
Always be Profitable!
JebraTrade
14 April 2021

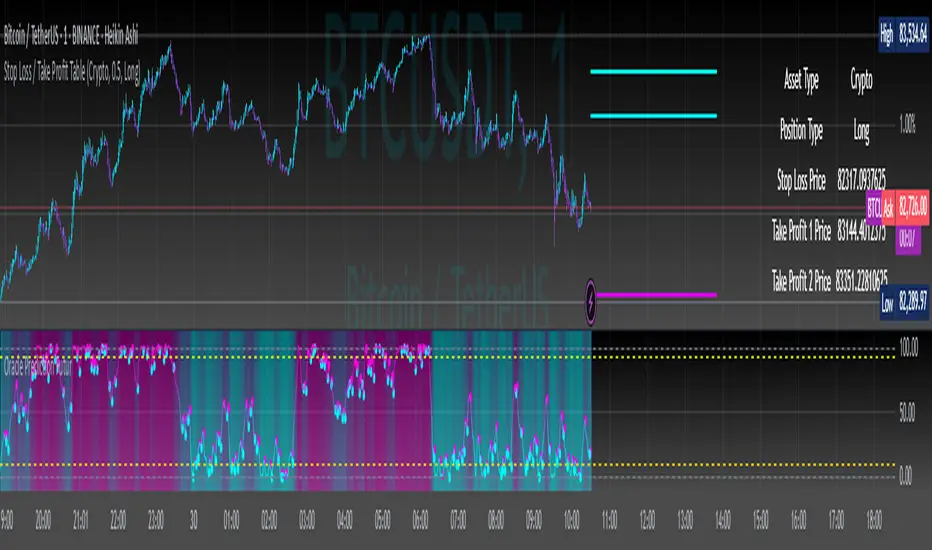
Stop Loss / Take Profit Table// (\_/)
// ( •.•)
// (")_(")
📈 Introducing the Stop Loss / Take Profit Table Indicator! 📈
Enhance your trading strategy with our powerful Stop Loss / Take Profit Table indicator, designed for traders in the Crypto, Stock, and Forex markets. This easy-to-use tool helps you manage risk and maximize profits by clearly displaying your Stop Loss and Take Profit levels based on your trading position.
Key Features:
Custom Asset Types: Choose between Crypto, Stock, or Forex to tailor the indicator to your specific trading style.
Dynamic Stop Loss & Take Profit Calculation: Set your desired Stop Loss percentage, and the indicator will automatically calculate your Stop Loss and two Take Profit levels based on different timeframes (1 min to 240 min).
Position Type Flexibility: Whether you're trading Long or Short, the indicator adjusts the calculations accordingly, providing you with precise price levels for effective risk management.
Visual Representation: Stop Loss and Take Profit levels are marked directly on the chart with distinctive horizontal lines in vibrant colors for easy reference.
Informative Table Display: A dedicated table displayed on the chart shows your asset type, position type, and calculated prices for Stop Loss and Take Profit levels, ensuring you have all critical data at a glance.
Alert Notifications: Stay informed with optional alerts that signal when your Stop Loss or Take Profit levels are hit, allowing you to react swiftly in fast-moving markets.
Why Use This Indicator?
Managing your trades is critical for success in the financial markets. With our Stop Loss / Take Profit Table, you can easily set your parameters and visually track your risk and reward levels, making it a practical addition to any trader's toolkit.
Get started today and take control of your trading strategy! ✨
Happy trading! 📊🚀
Scalping Tool with Dynamic Take Profit & Stop Loss### **Scalping Indicator: Summary and User Guide**
The **Scalping Indicator** is a powerful tool designed for traders who focus on short-term price movements. It combines **Exponential Moving Averages (EMA)** for trend identification and **Average True Range (ATR)** for dynamic stop loss and take profit levels. The indicator is highly customizable, allowing traders to adapt it to their specific trading style and risk tolerance.
---
### **Key Features**
1. **Trend Identification**:
- Uses two EMAs (Fast and Slow) to identify trend direction.
- Generates **Buy Signals** when the Fast EMA crosses above the Slow EMA.
- Generates **Sell Signals** when the Fast EMA crosses below the Slow EMA.
2. **Dynamic Take Profit (TP) and Stop Loss (SL)**:
- **Take Profit (TP)**:
- TP levels are calculated as a percentage above (for long trades) or below (for short trades) the entry price.
- TP levels are **dynamically recalculated** when the price reaches the initial target, allowing for multiple TP levels during a single trade.
- **Stop Loss (SL)**:
- SL levels are calculated using the ATR multiplier, providing a volatility-based buffer to protect against adverse price movements.
3. **Separate Settings for Long and Short Trades**:
- Users can independently enable/disable and configure TP and SL for **Buy** and **Sell** orders.
- This flexibility ensures that the indicator can be tailored to different market conditions and trading strategies.
4. **Visual Signals and Levels**:
- **Buy/Sell Signals**: Clearly marked on the chart with labels ("BUY" or "SELL").
- **TP and SL Levels**: Plotted on the chart for both long and short trades, making it easy to visualize risk and reward.
---
### **How to Use the Scalping Indicator**
#### **1. Setting Up the Indicator**
- Apply the indicator to your chart in TradingView.
- Configure the input parameters based on your trading preferences:
- **Fast Length**: The period for the Fast EMA (default: 5).
- **Slow Length**: The period for the Slow EMA (default: 13).
- **ATR Length**: The period for the ATR calculation (default: 14).
- **Buy/Sell TP and SL**: Enable/disable and set the percentage or ATR multiplier for TP and SL levels.
#### **2. Interpreting the Signals**
- **Buy Signal**:
- When the Fast EMA crosses above the Slow EMA, a "BUY" label appears below the price bar.
- The TP and SL levels for the long trade are plotted on the chart.
- **Sell Signal**:
- When the Fast EMA crosses below the Slow EMA, a "SELL" label appears above the price bar.
- The TP and SL levels for the short trade are plotted on the chart.
#### **3. Managing Trades**
- **Take Profit (TP)**:
- When the price reaches the initial TP level, the indicator automatically recalculates the next TP level based on the new close price.
- This allows traders to capture additional profits as the trend continues.
- **Stop Loss (SL)**:
- The SL level is based on the ATR multiplier, providing a dynamic buffer against market volatility.
- If the price hits the SL level, the trade is considered closed, and the indicator resets.
#### **4. Customization**
- Adjust the **Fast Length** and **Slow Length** to suit your trading timeframe (e.g., shorter lengths for scalping, longer lengths for swing trading).
- Modify the **ATR Multiplier** and **TP Percentage** to align with your risk-reward ratio.
- Enable/disable TP and SL for long and short trades based on your trading strategy.
---
### **Tips for Getting the Best Results**
1. **Combine with Price Action**:
- Use the Scalping Indicator in conjunction with support/resistance levels, candlestick patterns, or other technical analysis tools to confirm signals.
2. **Optimize for Your Timeframe**:
- For **scalping**, use shorter EMA lengths (e.g., Fast: 5, Slow: 13).
- For **swing trading**, use longer EMA lengths (e.g., Fast: 10, Slow: 20).
3. **Adjust Risk Management**:
- Use a smaller **ATR Multiplier** for tighter stop losses in low-volatility markets.
- Increase the **TP Percentage** to allow for larger price movements in high-volatility markets.
4. **Backtest and Practice**:
- Test the indicator on historical data to understand its performance in different market conditions.
- Use a demo account to practice trading with the indicator before applying it to live trading.
---
### **Conclusion**
The **Scalping Indicator** is a versatile and user-friendly tool for traders who want to capitalize on short-term price movements. By combining trend-following EMAs with dynamic TP and SL levels, it provides a clear and systematic approach to trading. Whether you're a scalper or a swing trader, this indicator can help you identify high-probability setups and manage risk effectively. Customize it to fit your strategy, and always remember to combine it with sound risk management principles for the best results.

Z PLUS table take profit & Stop lose ### General Description:
The **Z PLUS Take Profit & Stop Loss** indicator is designed to provide traders with a structured approach to setting take profit (TP) and stop loss (SL) levels. It integrates multiple technical analysis techniques, including moving averages, the Relative Strength Index (RSI), and the Average True Range (ATR), to generate signals for potential trade entries and exits.
Key features of this indicator include:
1. **Trend Detection** – Uses a moving average-based strategy combined with RSI confirmation to determine bullish or bearish trends. The system identifies trend reversals and signals potential long (buy) or short (sell) opportunities.
2. **ATR-Based Stop Loss** – Implements an adaptive stop-loss mechanism that adjusts dynamically based on market volatility. This ensures that stop losses are positioned in a way that minimizes premature exits while still protecting against excessive losses.
3. **Swing High & Swing Low Take Profit Levels** – Incorporates a swing high and swing low detection method to identify key levels for taking profits. These levels help traders optimize their risk-reward ratios.
4. **ADX for Trend Strength Confirmation** – Utilizes the Average Directional Index (ADX) to determine the strength of the trend and adjust stop-loss levels accordingly. The indicator differentiates between strong and weak trends to enhance decision-making.
5. **Visual Signals & Color Coding** – Provides visual cues such as colored stop-loss lines and plotted take-profit markers to enhance usability. The indicator dynamically updates these levels based on price movements.
6. **Flexible Configuration** – Allows users to modify key parameters such as ATR length, sensitivity factors, and profit target percentages to tailor the strategy to their specific trading style and market conditions.
This indicator is best suited for traders looking to improve their risk management strategies while maintaining a structured approach to profit-taking and stop-loss placement.

Stop Loss & Take Profit LevelsCalculate and Plot Stop Loss (SL) Levels:
The indicator calculates the Stop Loss price level based on the account balance, risk percentage, and the trade's entry price.
For long positions, the SL is below the entry price.
For short positions, the SL is above the entry price.
Calculate and Plot Take Profit (TP) Levels:
The indicator calculates up to three Take Profit (TP) levels, each based on different Risk/Reward (R:R) ratios.
The R:R ratio determines how much reward (profit) you aim to achieve relative to the risk (the distance between the entry price and the stop loss).
These TP levels are plotted on the chart as lines above the entry price for long positions or below the entry price for short positions.
Manual Entry Price:
The user can input a manual entry price to simulate trades or plan trades before entering the market. This makes it useful for pre-trade analysis.
Dynamic Position Type:
Users can toggle between Long or Short positions:
Long Position: The trader expects the price to go up.
Short Position: The trader expects the price to go down.
The indicator adapts its calculations (SL and TP levels) based on the selected position type.
Risk Calculation Based on Account Balance:
The indicator calculates the amount of capital at risk (in €) based on the trader's account balance and the selected risk percentage.
For example:
If the account balance is €1,000 and the Stop Loss percentage is 1%, the risk amount is €10.
Visual Representation on the Chart:
The following levels are plotted on the chart:
Stop Loss Level (Red Line): The price level at which the trader would exit the trade to limit losses.
Take Profit Levels (Green Lines): Up to three price levels where the trader could take profits based on R:R ratios.
Entry Price (Blue Line): The price level where the trade begins.
These lines are dynamically updated as inputs are changed, providing instant feedback to the trader.
